As the first step towards setting up my development environment for working on the Mouse Lock Implementation on Firefox, I cloned the unofficial Mozilla Central repo, having sanitized it for windows style line-endings. I checked out a branch that I will work on for the bug.
Next step was to download the Mozilla build package for Windows, that includes most of the tools I will need to setup, configure and then debug the Mozilla code.
After installing it I ran the start-msvc10 bat file and navigated to the mozilla-central directory. I edited the .mozconfig file for the firefox debug build with the following options:
. $topsrcdir/browser/config/mozconfig
mk_add_options MOZ_OBJDIR=@TOPSRCDIR@/ff-dbg-objdir
mk_add_options MOZ_MAKE_FLAGS=-j5
ac_add_options --enable-application=browser
ac_add_options --disable-optimize
ac_add_options --enable-debug
ac_add_options --enable-tests
The documentation I consulted for these configurations can be found here.
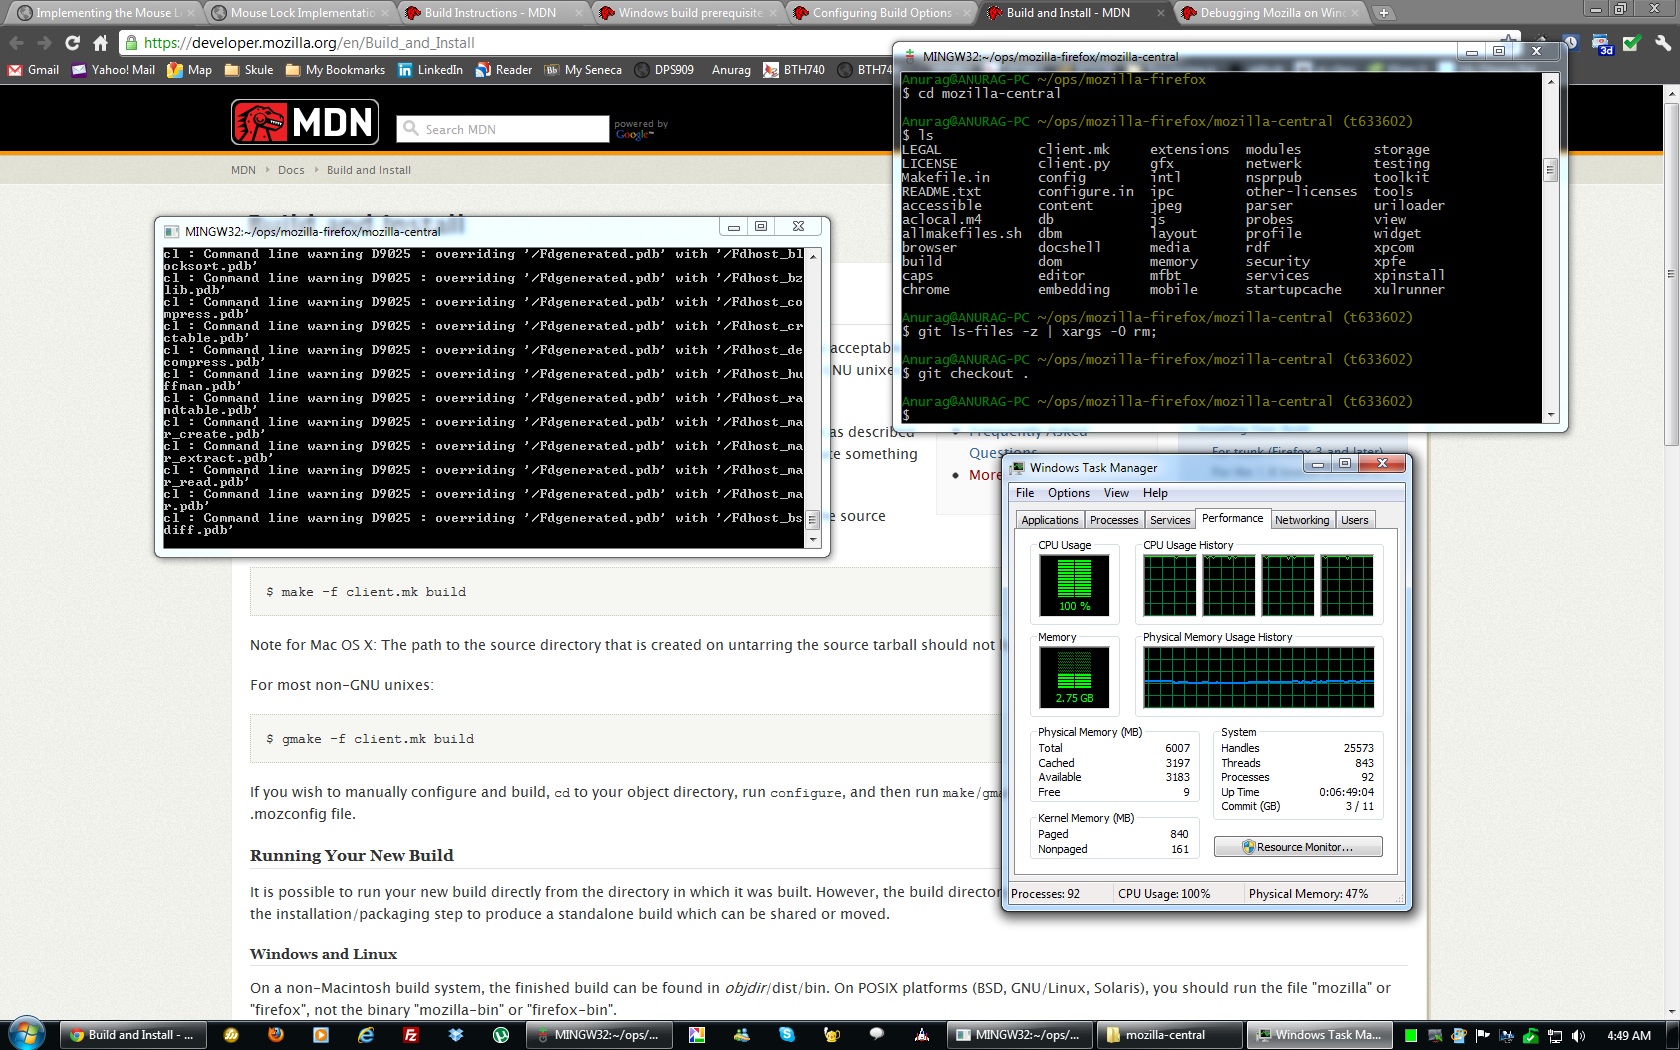
The next step was to just call the make command to do its thing:
time make -f client.mk build > log.txt
The log file of my make command is available here.
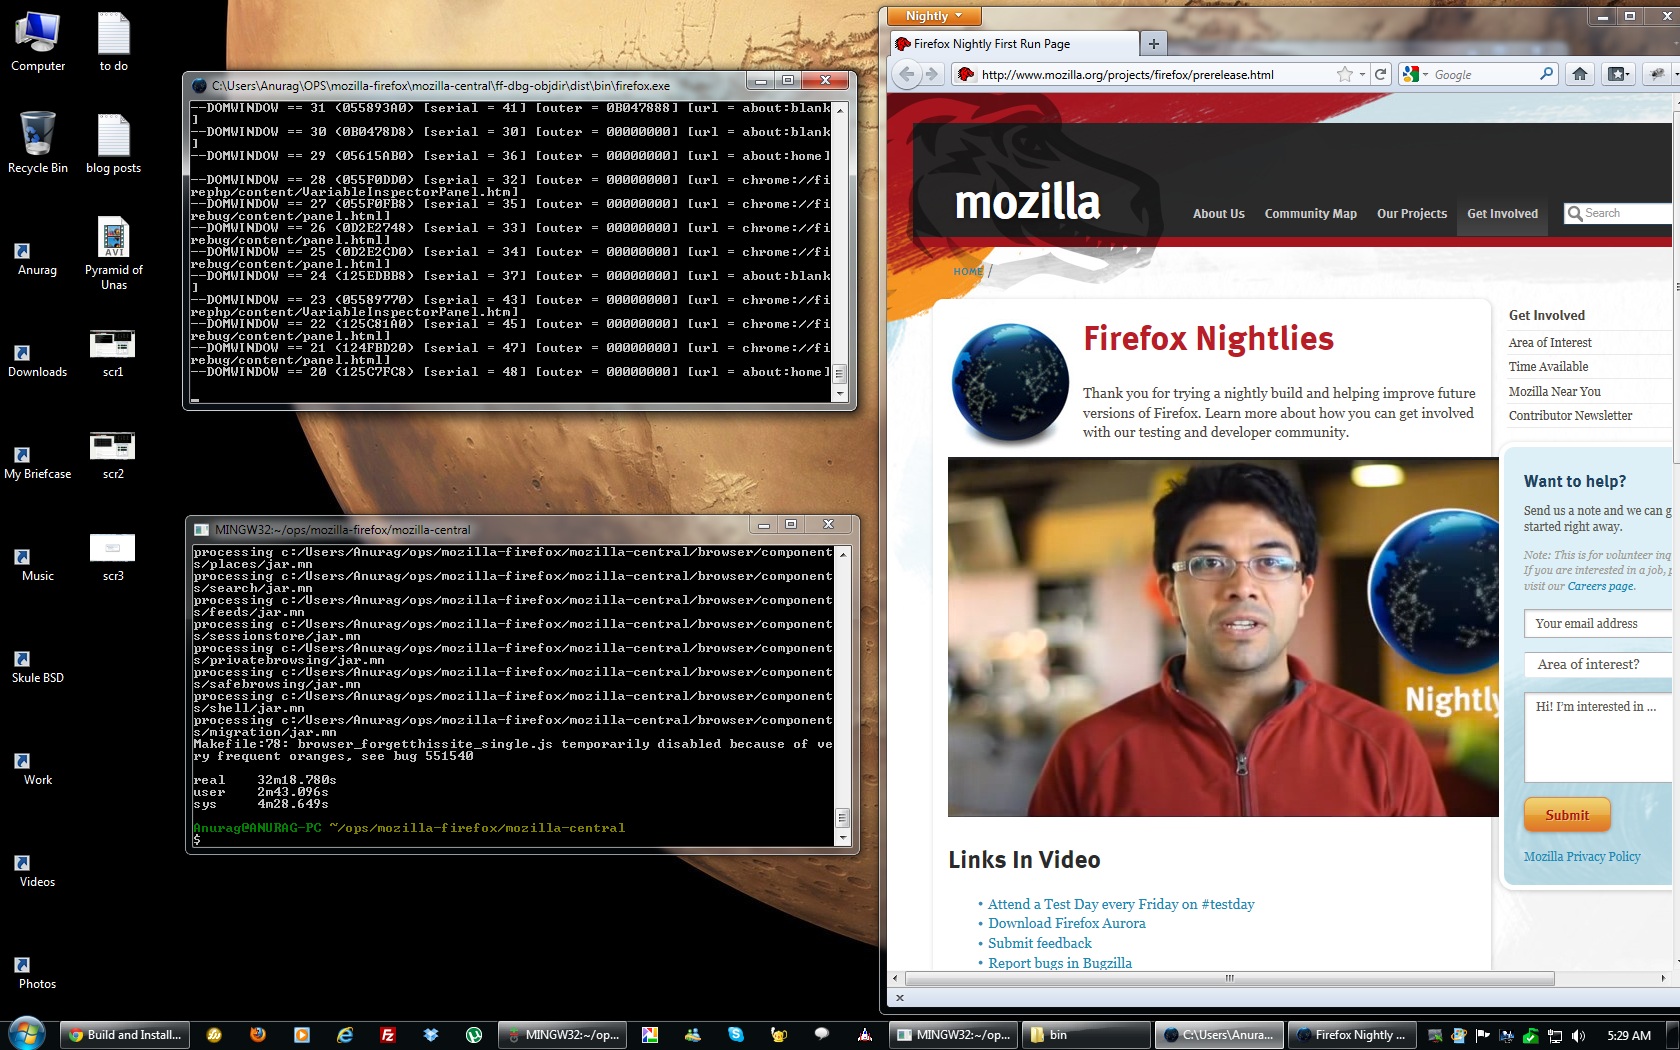
In an compile time of 32 minutes, my Intel i3 dual core took just 4 and a half minutes (running up to 5 processes concurrently as set in the configure options), to compile about 3680 object files (to calculate this, run this command on your objdir -> find . -name ‘*.obj’ -type f | wc -l).
I found my local firefox build in this location: \mozilla-central\ff-dbg-objdir\dist\bin
It ran with a lot of warnings, which I understand is normal, but I did get a local build of firefox in debug mode working on my machine!
Next step…diving into the code and start hacking. Stay tuned…

2 responses
Do you want to comment?
Comments RSS and TrackBack Identifier URI ?
Trackbacks